Tufte
A set of four plots based on Edward R. Tufte's designs in The Visual Display of Quantitative Information:
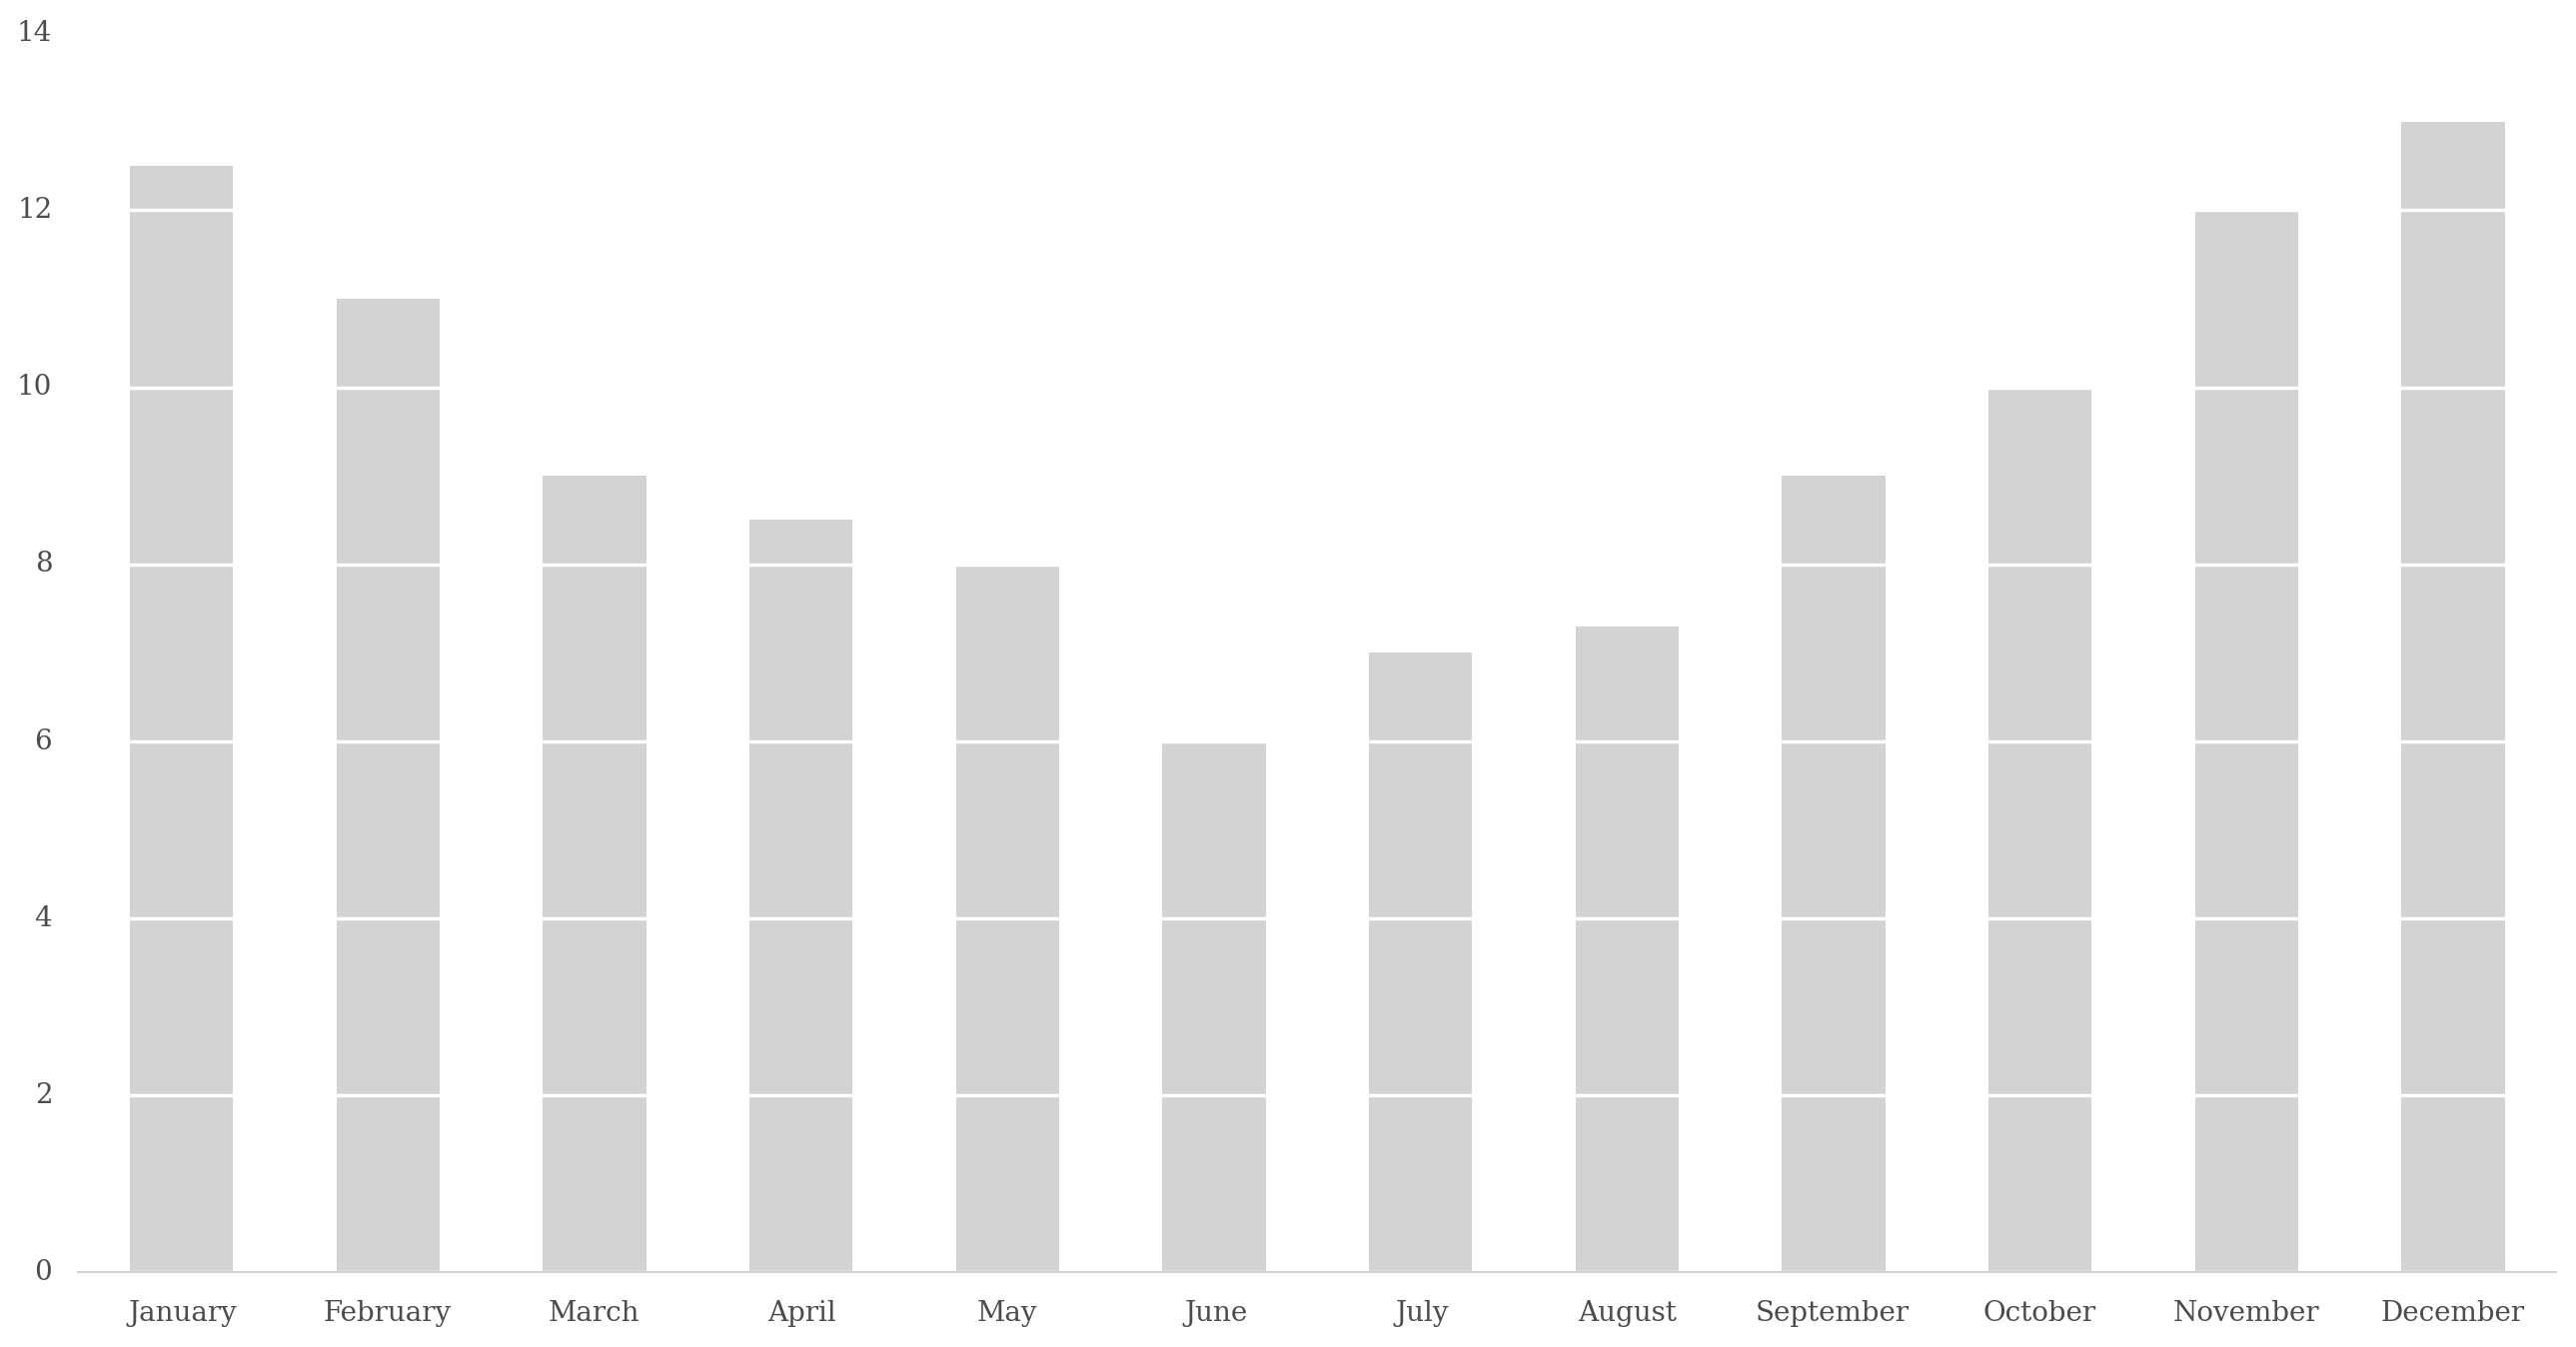
- bar
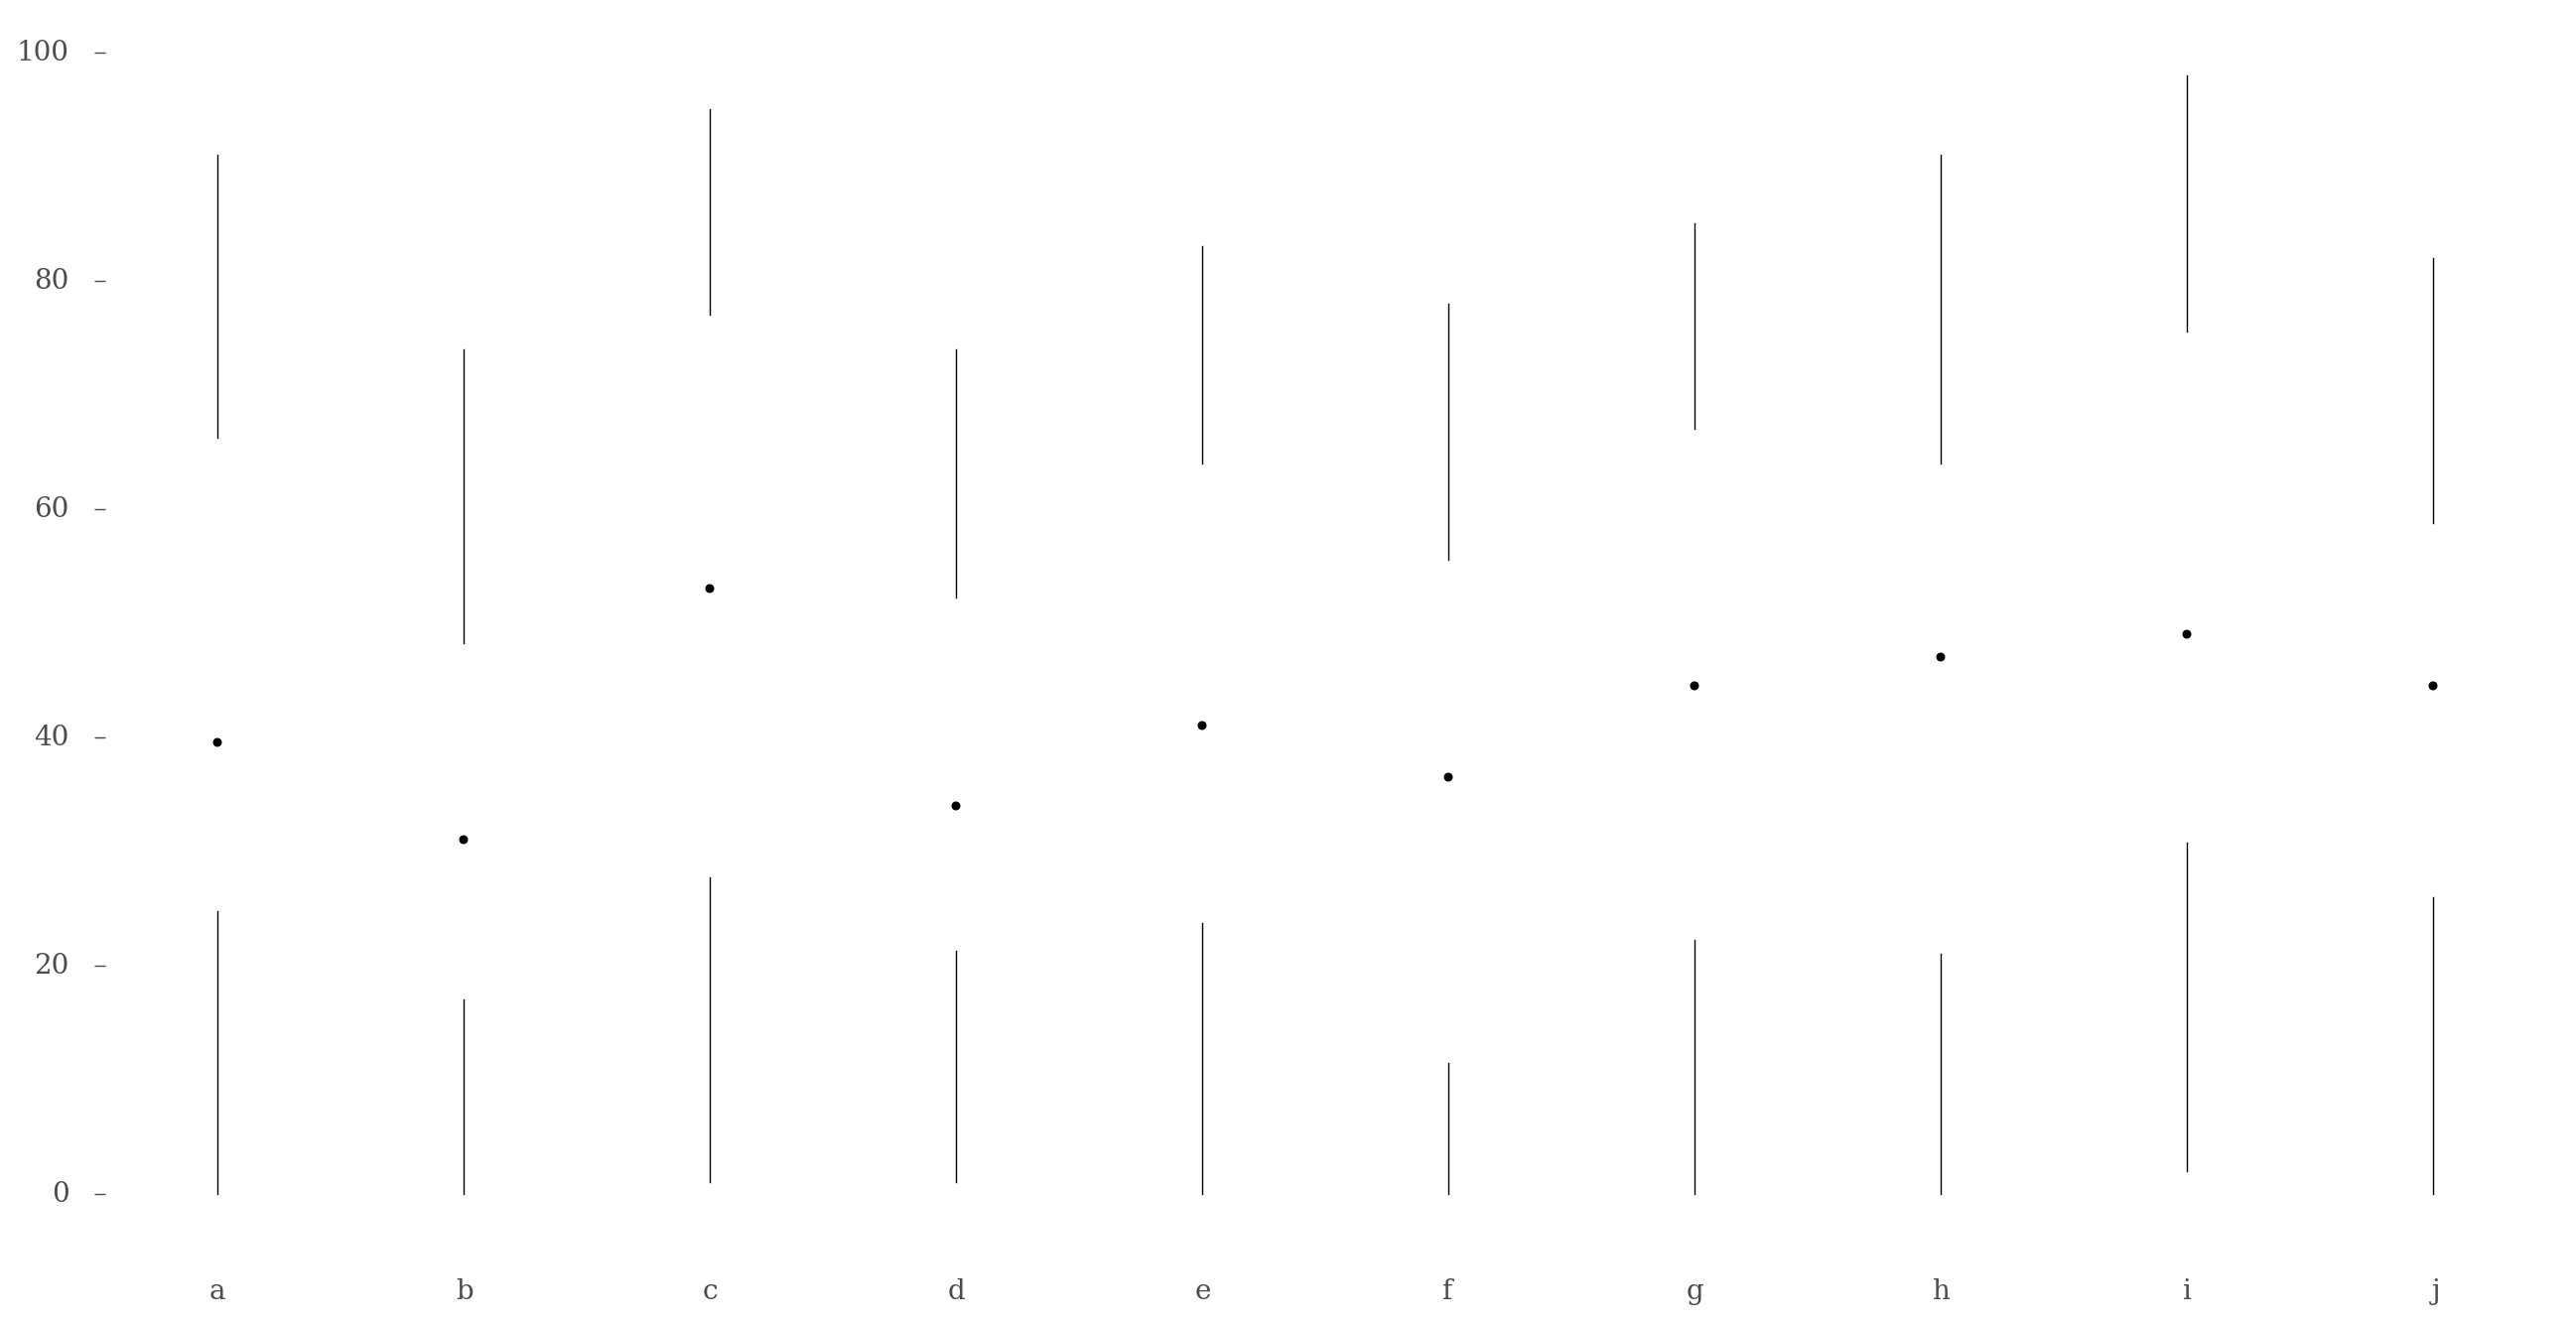
- boxplot
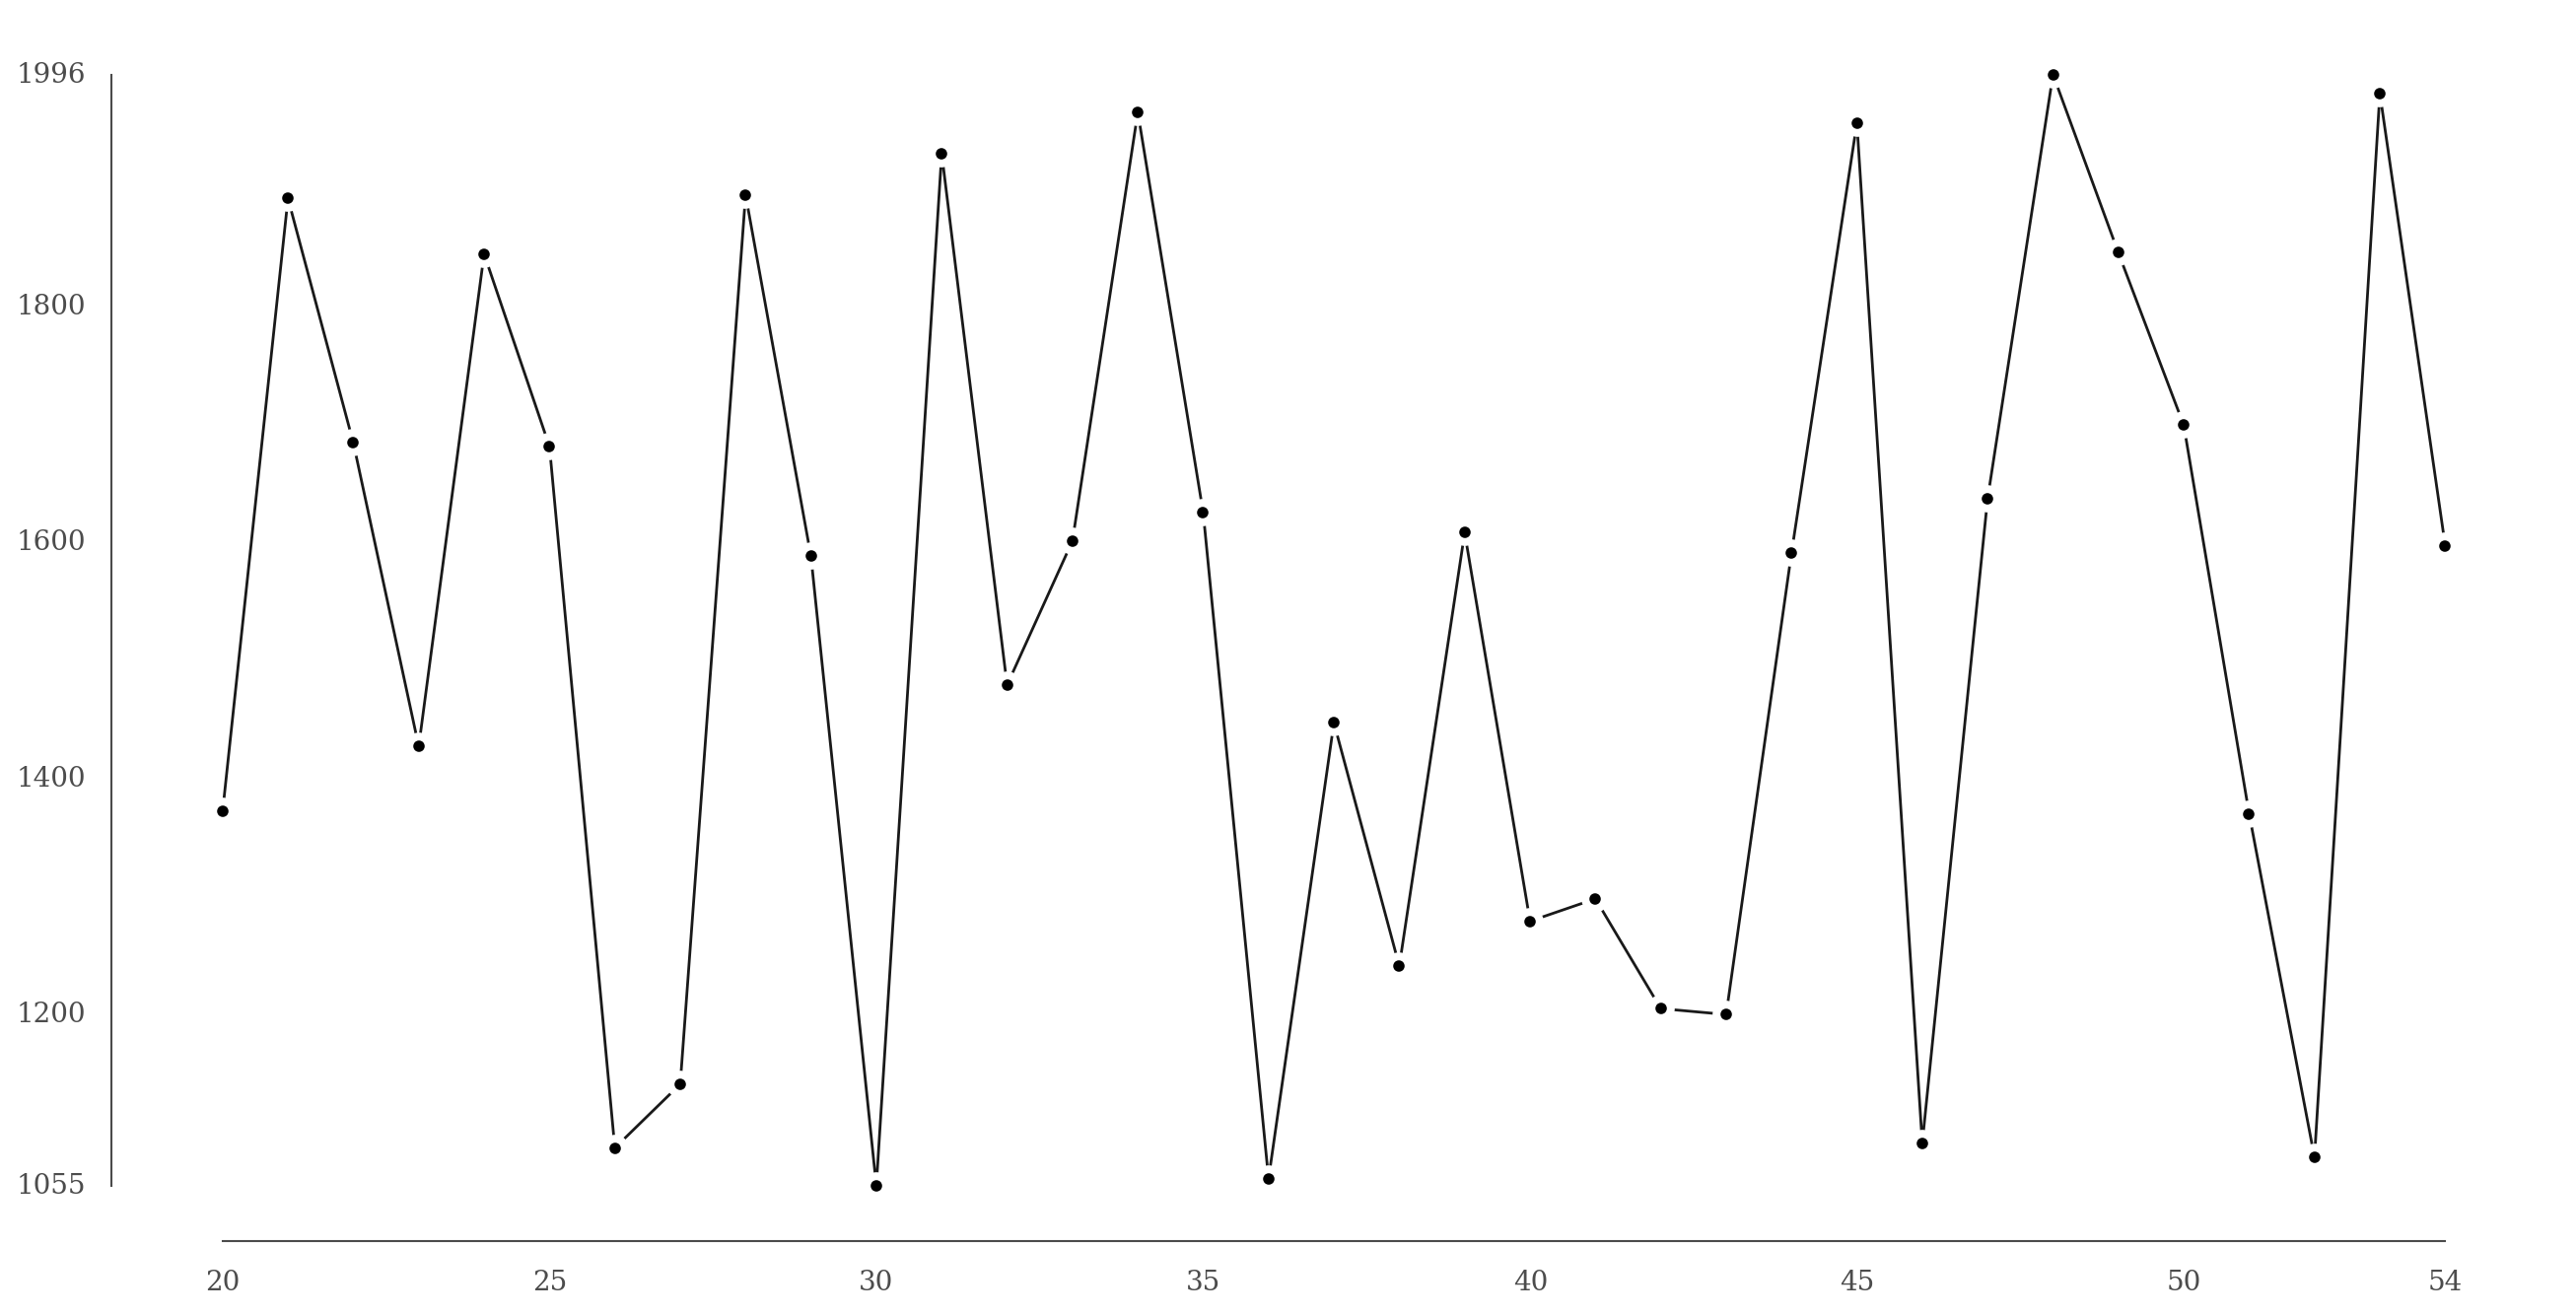
- line
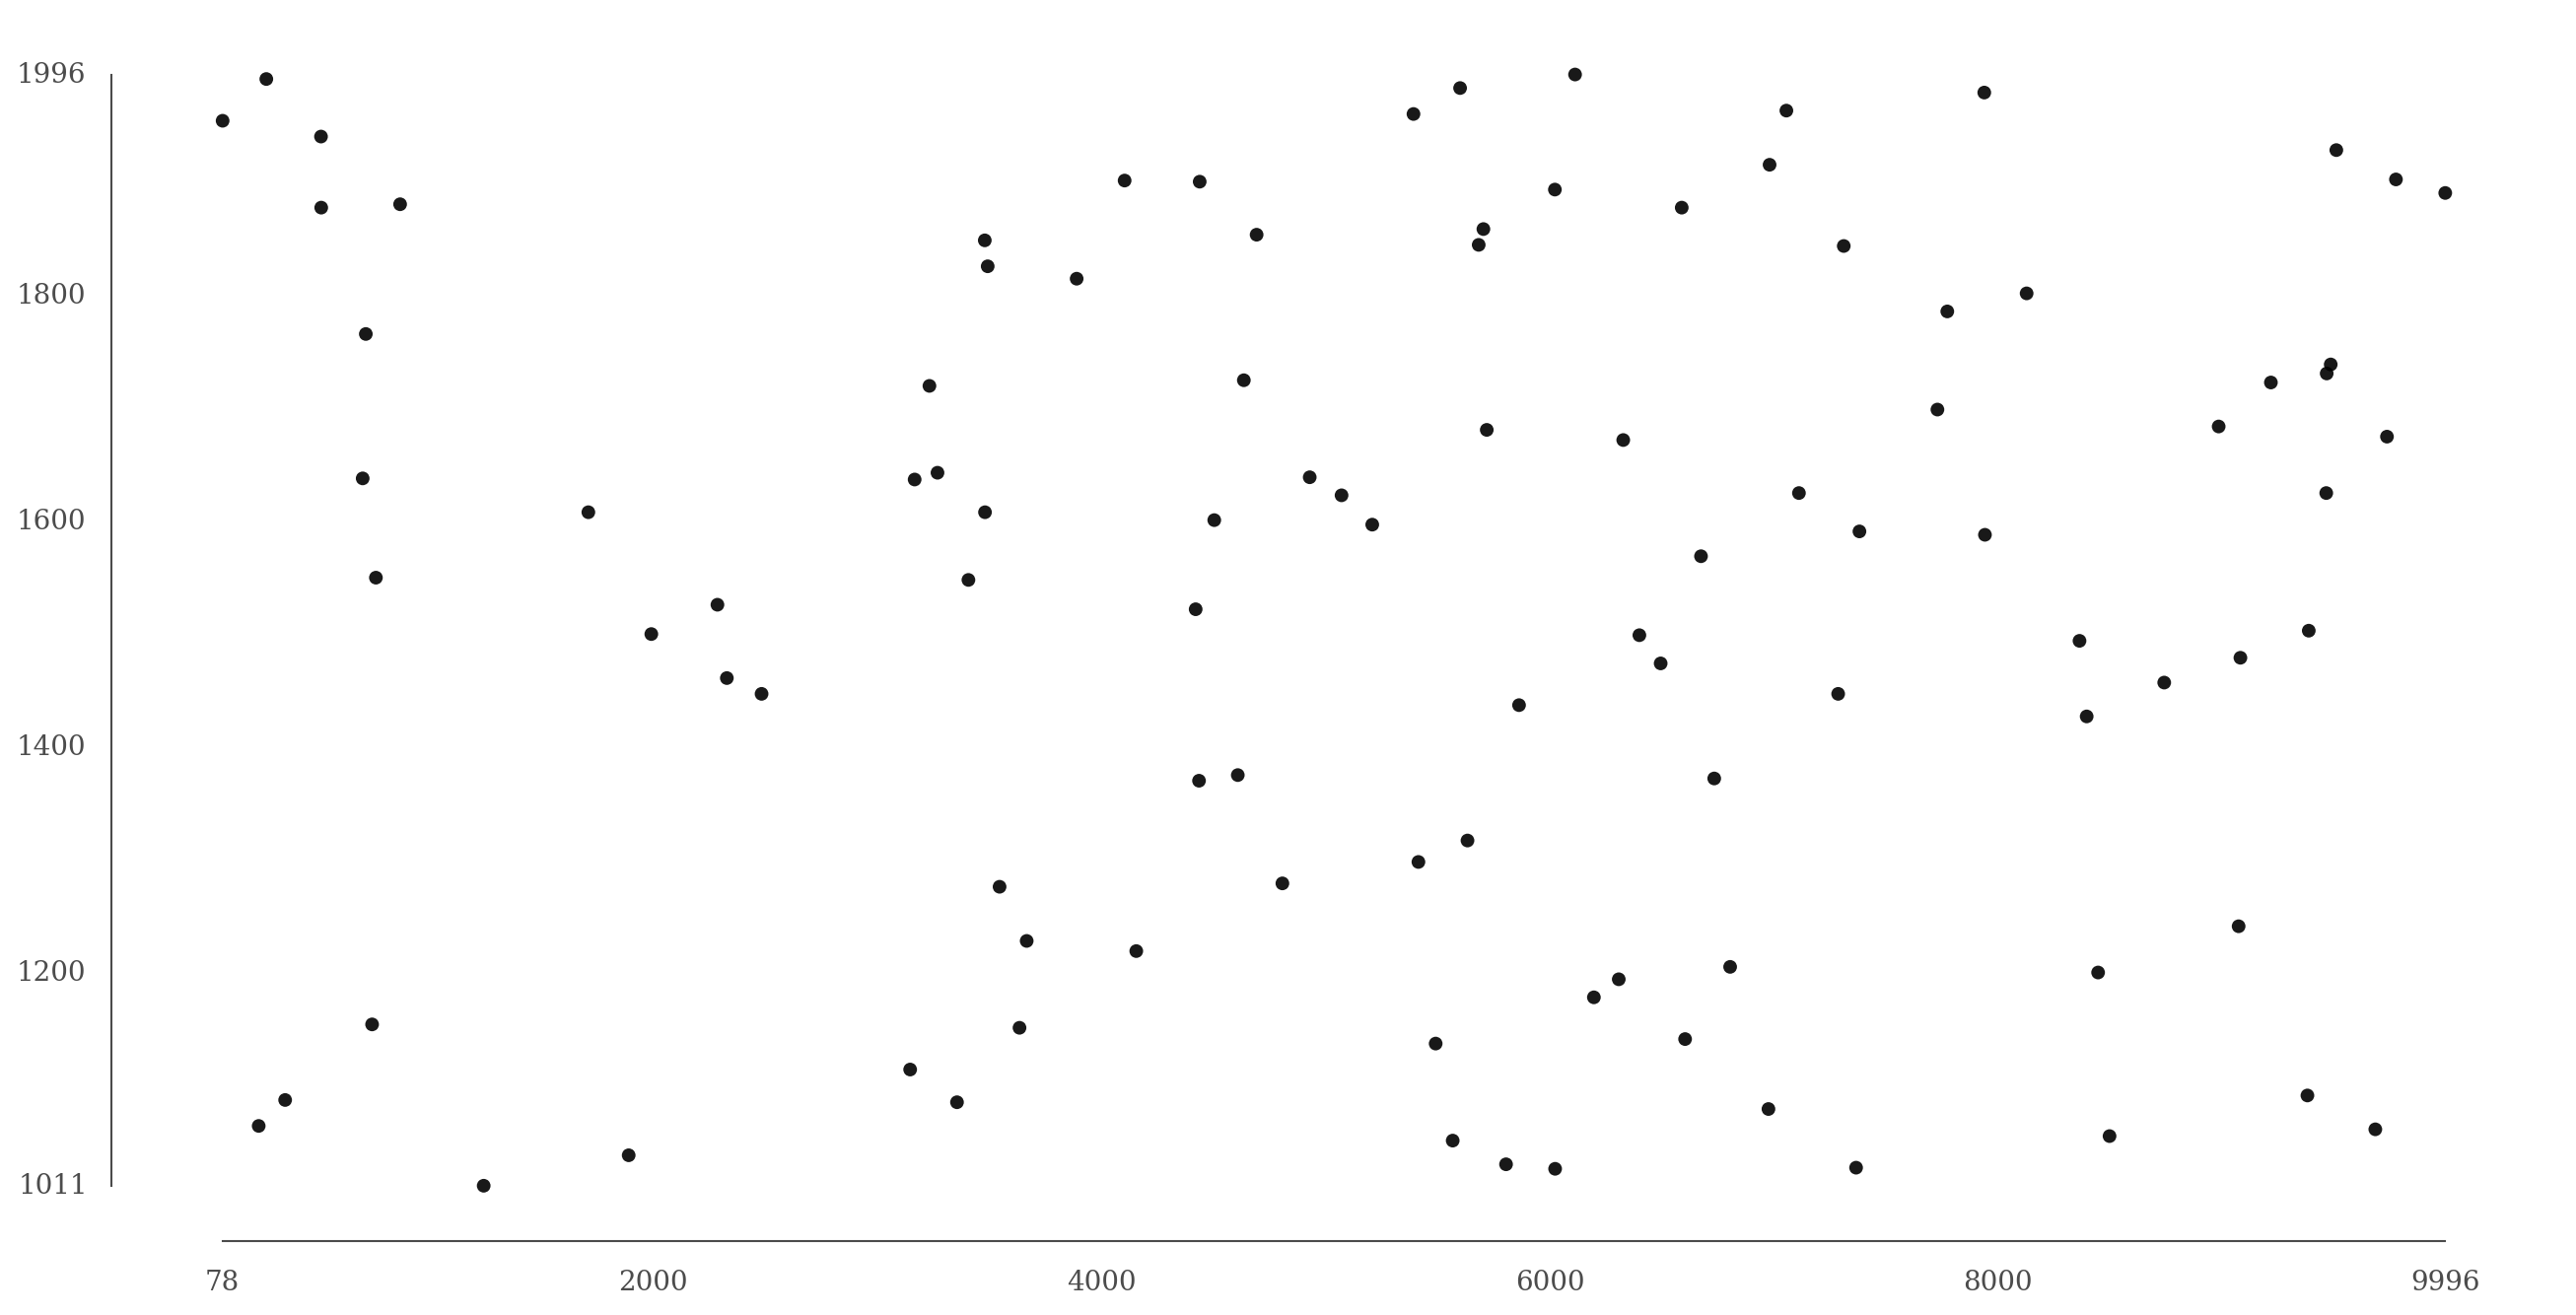
- scatter
All of these plots aim to maximize data-ink, the "non-erasable core of a graphic."
The "boxplot" (bplot), for example, removes
boxes and caps and simply shows a dot between two lines.
The dot represents the median and the lines correspond
to the top and bottom 25% of the data. The empty space
between the lines is the interquartile range.
The line and scatter plots make use of Tufte's range-frame concept, which aims to make the frame (axis) lines "effective data-communicating element[s]" by showing the minimum and maximum values in each axis. The default line style uses a circle marker with gaps between line segments.
This is built on top of matplotlib. This
means other functions or methods can be used in
conjunction with tufte plots.
For more information, checkout the repository on GitHub.